
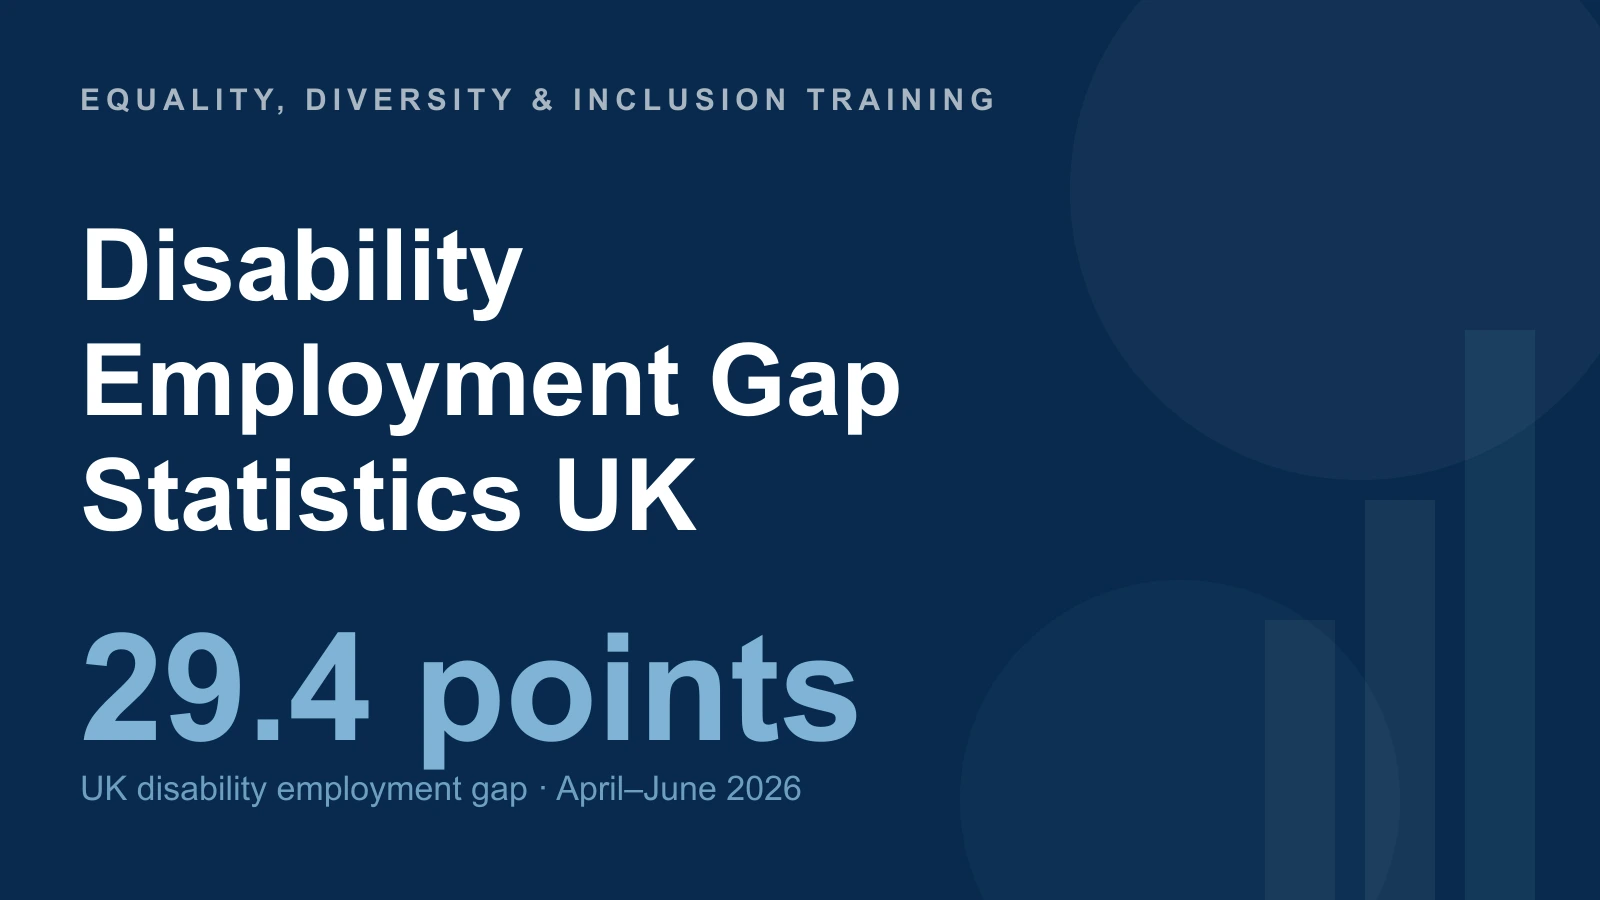
The disability employment gap compares the employment rates of disabled and non-disabled people. This guide uses the latest available quarterly UK figures and keeps older annual breakdowns and pay research clearly dated, so different definitions and populations are not mixed.
Key facts and figures
- 29.4 percentage points UK disability employment gap in April–June 2026, ages 16–64, on the ONS harmonised definition.
- 53.0% employment rate among disabled people, compared with 82.4% among non-disabled people, April–June 2026.
- 5.63 million disabled people aged 16–64 in employment, April–June 2026.
- 10.61 million disabled people aged 16–64 in the UK, April–June 2026.
- 4.45 million disabled people aged 16–64 economically inactive, April–June 2026.
- 12.7% ONS median disability hourly pay gap in 2023: £13.69 versus £15.69.
- £2.24 an hour difference in the TUC’s separately dated November 2025 analysis, a 15.5% gap.
- 31.4% employment rate among disabled people whose main condition was autism, UK Annual Population Survey 2024/25.
Reviewed 15 October 2026. Employment headlines use the ONS A08 release of 18 August 2026, covering April–June 2026. They are not seasonally adjusted. The annual condition-level and pay evidence uses older periods, stated separately.
What is the disability employment gap in the UK?
The gap is the difference between employment rates, measured in percentage points. In April–June 2026 the UK rate was 53.0% for disabled people aged 16–64 and 82.4% for non-disabled people: a 29.4-point gap. The underlying unrounded rates are used for calculations. This uses the harmonised disability definition; the workbook also contains a different Equality Act series covering Great Britain only.
| Measure (ages 16–64) | Figure | Data period / note |
|---|---|---|
| Disabled employment rate | 53.0% | UK, April–June 2026 |
| Non-disabled employment rate | 82.4% | UK, April–June 2026 |
| Disability employment gap | 29.4 percentage points | Difference between unrounded rates |
| Disabled people in employment | 5.63 million | UK, April–June 2026 |
| Working-age disabled people | 10.61 million | UK, April–June 2026 |
| Disabled and economically inactive | 4.45 million | UK, April–June 2026 |
| Disabled workers working part-time | 31.9% | UK APS 2024/25; non-disabled 21.1% |
The separate government 18–66 monitoring population and annual APS analysis answer different questions. Do not splice them into this quarterly 16–64 series.
How many disabled people are in work in the UK?
ONS estimates 5,626,460 disabled people aged 16–64 were employed in April–June 2026, approximately 5.63 million, compared with 5,475,267 in the same quarter of 2025. The estimated disabled working-age population was 10.61 million. Counts can rise because the population or reported disability prevalence changes, even without a comparable rise in employment rates.
The annual DWP breakdown reports 31.9% of disabled workers working part-time in 2024/25, compared with 21.1% of non-disabled workers. This describes working patterns; it is not proof that part-time work caused the whole hourly pay gap.
How many disabled people are economically inactive?
In April–June 2026, an estimated 4.45 million disabled people aged 16–64 were economically inactive, or 42.0% of that population. Inactivity means not meeting the labour-market definition of either employment or unemployment: a person may not be seeking work or may not be available to start.
Economic inactivity is not a judgement about a person’s capability or willingness to work. Health, caring, study and retirement can all be relevant. Employment support and reasonable adjustments should respond to individual circumstances rather than assumptions based on this national total.
What is the disability pay gap in the UK?
The ONS’s 2023 analysis reports median hourly pay of £13.69 for disabled employees and £15.69 for non-disabled employees: a 12.7% gap. It reports 15.5% for men and 9.6% for women. These are descriptive hourly earnings differences, not a direct measure of unequal pay for identical work.
The TUC’s November 2025 analysis reports a different 15.5% gap, equivalent to £2.24 per hour. Its illustration of more than £4,000 a year assumes 35 hours a week across a year. The two publications use different periods and methods, so their figures should not be averaged or described as the same estimate.
Which disabled people face the largest gaps?
In the DWP’s annual 2024/25 breakdown, the disability employment gap was 30.3 percentage points for men and 23.1 points for women. This reflects differences in the corresponding non-disabled employment rates as well as the disabled rates.
Among disabled people classified by their main health condition, the 2024/25 employment rate was 31.4% for autism and 68.8% for stomach, liver, kidney or digestive conditions. These survey categories do not represent every autistic person or predict an individual’s capacity for work. Multiple conditions and other characteristics also matter.
How is the disability employment gap changing?
The most recent comparable quarterly estimates do not show a further widening: the gap was 29.4 percentage points in April–June 2026, compared with 29.7 points a year earlier. Small survey movements should not be treated as proof of a lasting improvement or deterioration.
ONS warns about labour-market survey uncertainty. Use the same disability definition, age band and quarter when comparing years, and consider longer-term evidence. Changes in disability prevalence, population composition and the employment rates of both groups can affect the gap; these totals alone cannot identify the causes.
When will disability pay gap reporting become mandatory?
As at 15 October 2026, mandatory ethnicity and disability pay-gap reporting for large employers remains a government proposal. The March 2026 consultation response and draft primary legislation outline the intended framework, including a 250-employee threshold. They do not themselves start an employer reporting duty.
No first reporting-year date is asserted here. Employers choosing to report voluntarily should explain their definitions, response coverage, exclusions and methods so the results can be interpreted fairly.
Frequently asked questions
What is the disability employment gap in the UK?
It was 29.4 percentage points in April–June 2026 for people aged 16–64 on the ONS harmonised definition: 53.0% employed among disabled people versus 82.4% among non-disabled people.
What percentage of disabled people are in work?
ONS estimates 53.0% of disabled people aged 16–64 were employed in April–June 2026, equivalent to about 5.63 million people.
What is the disability pay gap?
ONS reports a 12.7% median hourly gap for 2023. The separately dated TUC November 2025 analysis reports 15.5%, or £2.24 per hour. These are different estimates.
How many working-age disabled people are there?
The ONS April–June 2026 UK estimate is 10.61 million people aged 16–64. This is not an all-age population count.
Is the disability employment gap widening?
The latest same-quarter comparison is 29.4 points in April–June 2026 versus 29.7 in 2025. Survey uncertainty means a small movement should not be presented as a proven trend.
Related guides
- Workplace Discrimination Statistics UK: Tribunal Claims, Prevalence & Protected Characteristics
- Neurodiversity Statistics UK: Autism, ADHD & Dyslexia Prevalence and Employment
- Ethnicity Pay Gap Statistics UK
- Reasonable Adjustments Under the Equality Act 2010: A UK Employer’s Guide
- Equality Act 2010: The Complete UK Guide
Sources & references
- ONS A08: August 2026 release, harmonised UK disability definition
- DWP: employment of disabled people 2025, corrected March 2026
- ONS: disability pay gaps, 2014–2023
- TUC: disability pay-gap analysis, November 2025
- Government consultation and response: proposed disability pay reporting
Closing the gap starts inside the workplace — train your team on the Equality Act 2010, reasonable adjustments and disability-inclusive practice.
Explore the Equality, Diversity & Inclusion course →
Mark writes about equality, diversity and inclusion, UK workplace compliance and accredited online training for Equality, Diversity & Inclusion Training, part of Online CPD Academy.