
This guide separates ethnicity pay comparisons by group, geography and data period. ONS’s detailed analysis covers 2022; Civil Service and London figures have their own scope. It also explains the proposed reporting framework as at 15 October 2026.
Key facts and figures
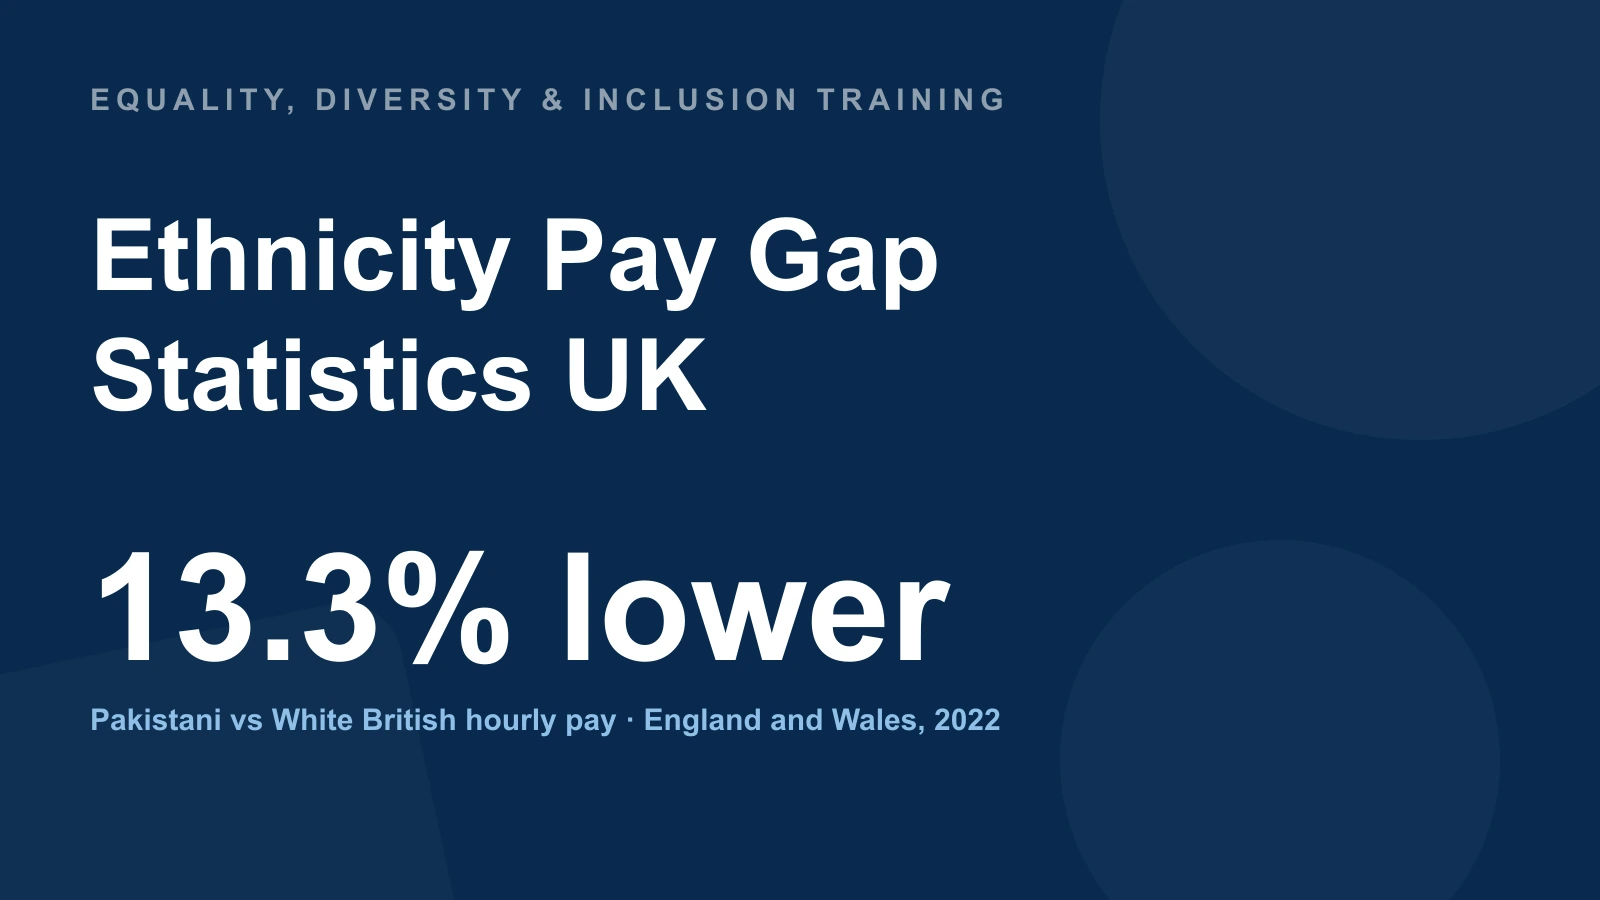
- 13.3% lower median hourly pay for Pakistani employees than White British employees, England and Wales 2022.
- 17.5% lower median hourly pay for Bangladeshi employees than White British employees, England and Wales 2022.
- 23.0% higher median hourly pay for Chinese employees than White British employees, England and Wales 2022.
- 5.7% UK median hourly gap between Black employees (£13.53) and White employees (£14.35), 2022.
- 22.5% White–minority-ethnic median hourly gap in London in 2022, versus 0.9% elsewhere in England and Wales, GLA.
- 250+ employees proposed threshold for mandatory ethnicity pay reporting; legislation and commencement are still required.
- 87% of 857 consultation respondents supported mandatory ethnicity reporting, government response March 2026.
- 23% of employers in PwC’s 2020 survey calculated an ethnicity pay gap; 10% of all surveyed employers published it.
Reviewed 15 October 2026. The ONS detailed analysis still covers 2022. The 2026 Civil Service ethnicity pay bulletin is scheduled for 28 October, after this review.
Why is there no single UK ethnicity pay gap figure?
Ethnicity pay gaps depend on the groups compared, geography, period and pay measure. ONS’s latest detailed analysis covers 2012–2022: its five broad ethnic groups cover the UK, while its 18-category analysis covers England and Wales. White and White British are different comparator populations.
The estimates concern median gross hourly earnings. A positive ONS gap means lower pay than the reference group; a negative gap means higher pay. Differences in occupations, qualifications, location and other factors contribute, and an overall gap is not proof of unequal pay for the same work. ONS advises caution because declining survey samples increased uncertainty in 2020–2022.
Which ethnic groups face the largest pay gaps?
ONS Figure 2 gives a 13.3% gap for Pakistani employees and 17.5% for Bangladeshi employees relative to White British employees in England and Wales in 2022. Mixed White and Black Caribbean employees had the lowest reported median, £11.75, an 18.5% gap.
Chinese and Indian employees’ medians were respectively 23.0% and 19.9% above the White British median of £14.42. White Irish employees, outside this selected table, had the highest median at £20.20, 40.1% above White British employees.
| Ethnic group | ONS raw gap, 2022 | Difference from White British |
|---|---|---|
| Chinese | −23.0% | 23.0% higher |
| Indian | −19.9% | 19.9% higher |
| White British comparator | Reference group | — |
| Bangladeshi | 17.5% | 17.5% lower |
| Pakistani | 13.3% | 13.3% lower |
| Mixed White and Black Caribbean | 18.5% | 18.5% lower |
All rows refer to England and Wales, 2022. These are selected groups, not an exhaustive ranking. Sampling uncertainty is shown in the ONS chart; an unexplained residual after statistical adjustment does not itself identify discrimination.
What is the pay gap for Black employees?
In the UK’s five-group analysis for 2022, Black, African, Caribbean or Black British employees had median hourly pay of £13.53 versus £14.35 for White employees, a gap of about 5.7%. This broad group earned less than White employees in each year of the 2012–2022 series.
The adjusted analysis uses a different comparison: UK-born Black employees versus UK-born White employees. Before adjustment, the Black group earned 6.5% more; after holding selected pay-related characteristics constant, it earned 5.6% less. The adjusted result should not be described as the same 5.7% raw gap simply persisting.
Why is the ethnicity pay gap so much larger in London?
GLA’s 2022 data show median hourly pay of £20.68 for White employees and £16.02 for minority-ethnic employees in London, a 22.5% gap. Outside London in England and Wales, the corresponding medians were £13.57 and £13.45, a 0.9% gap.
These are historical regional comparisons using broad groups. They do not prove what caused a particular employer’s gap or establish a target that every employer should match. Local occupation and workforce composition should be considered alongside the comparison.
What does the Civil Service ethnicity pay gap show?
At 31 March 2025, the Civil Service median hourly pay gap was 4.5% for Asian employees and 4.5% for Black employees relative to White employees. The mean gap for Black employees was 7.9%. These figures cover the Civil Service, not the whole public sector or the national workforce.
Median bonus gaps were 42.9% for Black employees and 29.1% for Asian employees. Bonus and hourly-pay measures use different payments and populations and should not be merged.
The 2025 ethnicity pay bulletin remains the latest available at this review. The 2026 Civil Service collection schedules the next ethnicity pay bulletin for 28 October 2026.
When will ethnicity pay gap reporting become mandatory?
The government’s 25 March 2026 consultation response sets out plans to require ethnicity and disability pay-gap reporting for employers with 250 or more employees. Of 857 consultation responses, 87% supported mandatory ethnicity reporting. As at 15 October 2026, these proposals are not a reporting duty already in force and no commencement date should be inferred.
The intended scope includes private and voluntary-sector employers in Great Britain and relevant English and non-devolved public bodies. Public-sector arrangements in Scotland and Wales differ; Northern Ireland is outside this proposed framework.
The proposed framework uses six pay measures, workforce composition and declaration rates, and action plans. A binary ethnic-minority/White comparison is proposed as a minimum; more detailed breakdowns are encouraged where safe and meaningful. Final legislation and guidance will determine the requirements.
How many employers already report their ethnicity pay gap?
PwC’s 2020 survey found 23% of participating employers calculated their ethnicity pay gap, up from 5% in its 2018 comparison. Ten per cent of all surveyed employers voluntarily disclosed a gap, compared with 3% in 2018. These are dated survey findings, not a current national census of reporting.
Data completeness, small groups and privacy affect what employers can publish. Voluntary disclosure should explain the method, comparator, period and declaration rate. A planned mandatory scheme should not be described as already resolving those issues or as guaranteed to begin in 2027–2028.
Frequently asked questions
What is the UK ethnicity pay gap?
There is no single figure that captures all groups. ONS’s 2022 UK broad-group comparison puts Black employees’ median hourly pay about 5.7% below White employees. Detailed England and Wales comparisons use White British as the reference.
Is ethnicity pay-gap reporting mandatory?
The government has proposed a duty for large employers, but it is not in force as at 15 October 2026. Existing voluntary reporting and equality duties are separate matters.
When will it start?
A fixed start date has not been established by the sources reviewed. Legislation, commencement and final guidance are needed.
Which groups had the largest detailed gaps?
In the 2022 England and Wales chart, Mixed White and Black Caribbean employees had an 18.5% gap, Bangladeshi employees 17.5% and Pakistani employees 13.3% relative to White British employees. White Irish employees had the highest median earnings.
What is proposed for reporting?
Six pay measures, composition and declaration information, action plans and a minimum binary ethnicity comparison, with scope for more detail. These remain proposed requirements.
Related guides
- Workplace Discrimination Statistics UK: Tribunal Claims, Prevalence & Protected Characteristics
- Disability Employment Gap Statistics UK
- Women in Leadership Statistics UK
- Equality Act 2010: The Complete UK Guide
- The Nine Protected Characteristics Under the Equality Act 2010
Sources & references
- ONS — Ethnicity pay gaps, UK: 2012 to 2022
- ONS — Figure 2: raw pay gaps, detailed ethnicity, England and Wales 2022
- Government — Ethnicity and disability pay-gap consultation response, 25 March 2026
- Cabinet Office — Civil Service ethnicity pay gap, 31 March 2025
- Cabinet Office —2026 release schedule; ethnicity pay analysis due 28 October 2026
- Greater London Authority — London ethnicity pay-gap data, 2022
- PwC — Ethnicity pay reporting survey, 2020
Mandatory pay gap reporting will put every large employer’s numbers in public view — make sure your team understands the Equality Act 2010 and inclusive practice before the data does the talking.
Explore the Equality, Diversity & Inclusion course →
Mark writes about equality, diversity and inclusion, UK workplace compliance and accredited online training for Equality, Diversity & Inclusion Training, part of Online CPD Academy.