
Older workers’ employment varies by age, health and location. This guide uses the latest DWP annual analysis, published in September 2026, to distinguish people in work, people seeking a job and people outside the active labour market.
Key facts and figures
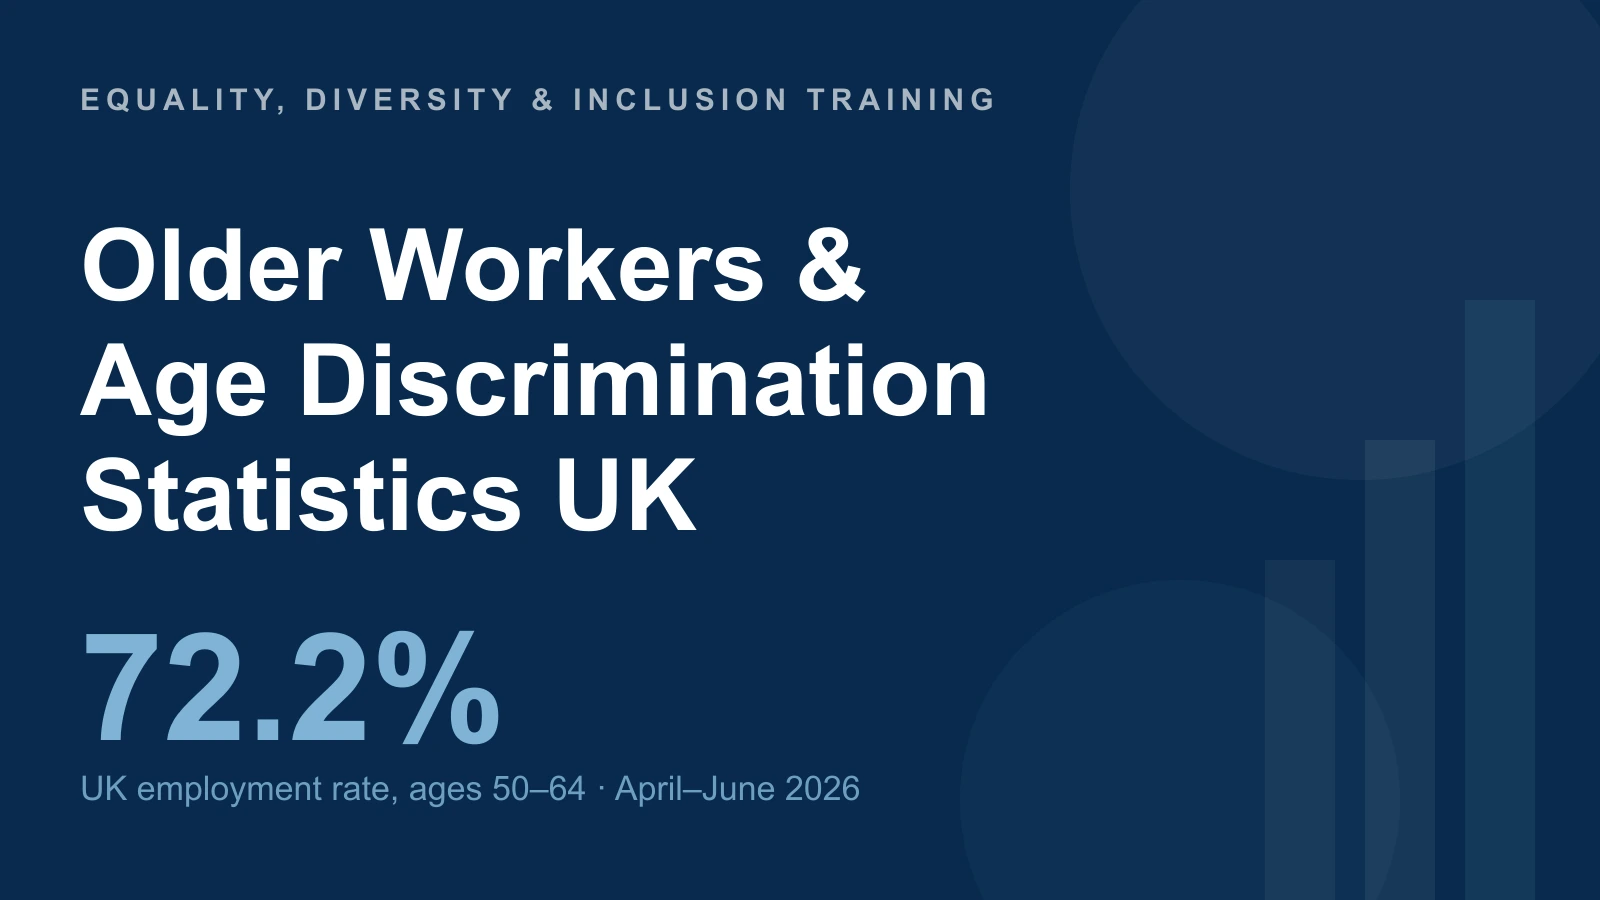
- 72.2% employment rate for UK adults aged 50–64 in April–June 2026.
- 25.7% economic inactivity rate among 50–64-year-olds in April–June 2026.
- 3.4 million people aged 50–64 were economically inactive in April–June 2026.
- 866,000 people aged 50–64 were seeking work, or inactive but willing or wanting to work, April–June 2026.
- 43.8% of inactive 50–64-year-olds cited sickness or disability as their main reason for not looking for work.
- 65.8 and 65.1 estimated average labour-market exit ages for men and women respectively in 2026.
- 585,000 inactive 50–64-year-olds were willing or wanted to work in April–June 2026.
- £9 billion a year modelled economic gain in the Centre for Ageing Better’s 2025 case for a 75% employment target by 2030; not a measured current return.
Reviewed 15 October 2026. The main figures come from DWP’s 24 September 2026 release, using April–June 2026 Labour Force Survey data. The annual label does not mean a full calendar-year average; short-term survey changes require caution.
What is the employment rate for over-50s in the UK?
DWP reports a 72.2% employment rate for people aged 50–64 in April–June 2026, compared with 71.6% a year earlier and 72.6% in 2019. The latest 0.6-percentage-point increase is not statistically significant. The age group excludes people aged 65 and over.
| Measure (ages 50–64) | April–June 2026 | Context / note |
|---|---|---|
| Employment rate | 72.2% | 0.6pp higher than 2025; not statistically significant |
| Economic inactivity rate | 25.7% | 0.4pp lower than 2025; not statistically significant |
| Economically inactive people | About 3.4 million | Neither employed nor meeting unemployment definition |
| Seeking work or wanting a job | About 866,000 | Unemployed plus willing/wanting inactive group |
| Highest-employment UK nation | 73.0% (England) | Same age band and quarter |
| Lowest-employment UK nation | 65.9% (Wales) | Same age band and quarter |
DWP uses the same quarter each year for consistency. The monthly ONS age dataset can cover a later rolling three-month period and should not be substituted without relabelling the comparison.
How many older workers are economically inactive?
An estimated 3.4 million people aged 50–64 were economically inactive in April–June 2026, a rate of 25.7%. The rate remains slightly above 25.5% in 2019. Inactivity is different from unemployment: an inactive person is not working and is not seeking work or is unavailable to start.
The latest figures should not be described using an older percentage contribution to the pandemic-era rise. The time window and population determine that calculation, and the current estimates show a more varied pattern across older age bands.
How many older workers are out of work but want a job?
Around 866,000 people aged 50–64 were either unemployed or inactive but willing or wanting to work in April–June 2026. Within this total, approximately 585,000 were inactive but willing or wanting to work.
Of that inactive-but-willing group, 62.2% cited sickness, injury or disability as the main reason for not looking for work. Wanting a job does not mean a person can immediately take any available role; suitable work and support may be important.
Why do older workers leave the workforce early?
Among all inactive people aged 50–64 in April–June 2026, 43.8% gave sickness or disability as the main reason for not looking for work, 31.1% retirement and 12.7% looking after home or family. Caring was reported by 16.5% of inactive women and 7.4% of inactive men. These are reasons for current inactivity, not necessarily the reason someone originally left their last job.
The estimated average exit age was 65.8 for men and 65.1 for women in 2026. It is a population indicator, not an individual retirement deadline. The State Pension age is rising gradually from 66 to 67 between 2026 and 2028; a single age should not be stated as applying to everyone.
How common is age discrimination in UK recruitment?
Age discrimination can affect recruitment, promotion, training and treatment at work. Survey evidence about people’s experiences is different from counts of tribunal claims or proven unlawful decisions; neither provides a complete current prevalence rate.
Under the Equality Act 2010 in Great Britain, age is a protected characteristic. Direct and indirect age discrimination may be lawful where the relevant objective-justification test is met. Recruitment criteria should be tied to the actual role rather than assumptions that older candidates are unable to learn or younger candidates lack the required ability.
Are older workers being left behind on training?
Training and development should be based on a person’s role and needs rather than assumptions about their age. Flexible work, suitable support and fair access to progression can help employers retain experienced people.
The Centre for Ageing Better’s 2025 report estimates that achieving a 75% employment rate for 50–64-year-olds by 2030 could add at least £9 billion annually to the economy and £1.6 billion in income tax and National Insurance. These are modelled benefits of a proposed target, not observed savings or a guaranteed return from an employer’s training programme.
Frequently asked questions
How many older people are out of work but want a job?
DWP estimates about 866,000 people aged 50–64 were unemployed or inactive but willing or wanting to work in April–June 2026. Around 585,000 were in the inactive group.
What is the employment rate for over-50s?
For the specific 50–64 age band, it was 72.2% in April–June 2026. That does not describe everyone aged over 50, including pension-age adults.
Why are older people economically inactive?
Among inactive 50–64-year-olds, 43.8% cited sickness or disability, 31.1% retirement and 12.7% looking after home or family in April–June 2026.
Is age discrimination unlawful in recruitment?
Age discrimination is covered by the Equality Act in Great Britain, subject to statutory exceptions and objective justification where applicable. A particular decision must be assessed on its facts.
What is the average age people stop working?
The DWP estimated average labour-market exit age in 2026 was 65.8 for men and 65.1 for women. This is a statistical indicator, not a mandatory retirement age.
Related guides
- Disability Employment Gap Statistics UK: Rates, Pay Gap & Trends
- Workplace Discrimination Statistics UK: Tribunal Claims, Prevalence & Protected Characteristics
- Menopause in the Workplace Statistics UK
- Equality Act 2010: The Complete UK Guide
- The Nine Protected Characteristics Under the Equality Act 2010
Sources & references
- DWP: older workers, September 2026 release
- Centre for Ageing Better: State of Ageing 2025, work
- Acas: age discrimination
- GOV.UK: State Pension age
Age is a protected characteristic — make sure your team recruits, retains and supports older workers within the law. Train them on the Equality Act 2010 and age-inclusive practice.
Explore the Equality, Diversity & Inclusion course →
Mark writes about equality, diversity and inclusion, UK workplace compliance and accredited online training for Equality, Diversity & Inclusion Training, part of Online CPD Academy.