
Socio-economic background can be associated with earnings and progression even within professional occupations. This guide separates pooled pay research, employer surveys and current legal duties so that historical findings are not mistaken for current salaries or a measure of individual discrimination.
Key facts and figures
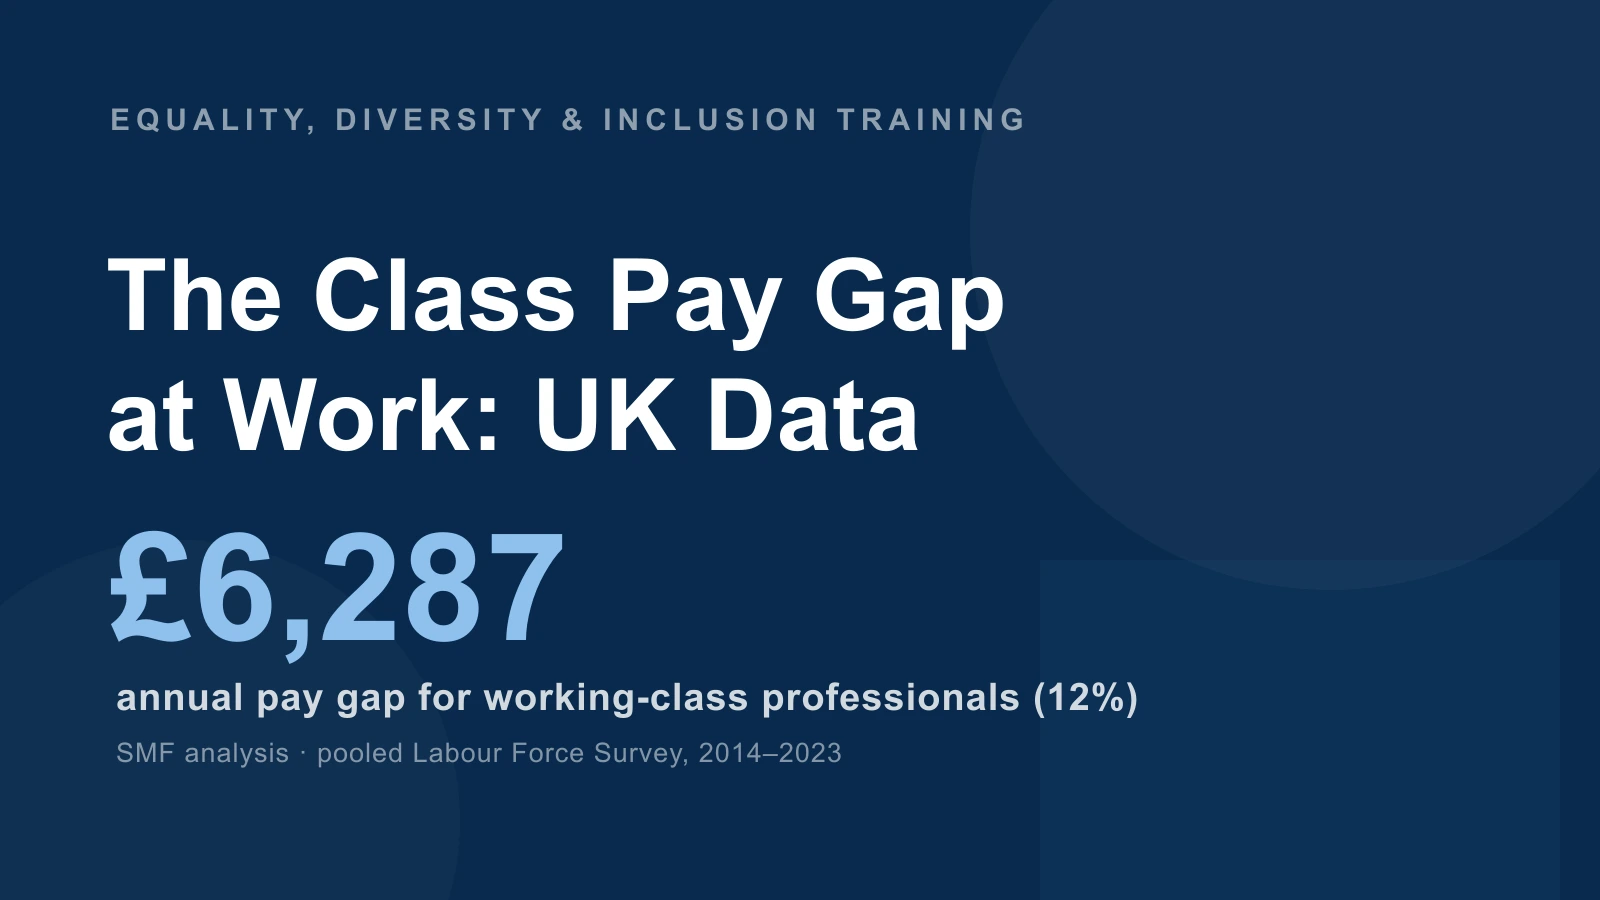
- £6,287 annual average class pay gap in the Social Mobility Foundation’s pooled 2014–2023 Labour Force Survey analysis.
- 12% lower average pay for working-class-origin employees in higher managerial, administrative and professional occupations in that analysis.
- £45,924 average salary for the working-class-origin group, compared with £52,211 for the professional-managerial-origin group.
- £7,774 annual gap within the private-sector group in the same pooled research.
- £6,855 annual gap between women from the two background groups in the same pooled research.
- 36 entrants to the Social Mobility Employer Index reported measuring their class pay gap in 2025, up from 26 in 2024.
- 28% of senior leaders in Progress Together’s reported financial-services data were from lower socio-economic backgrounds, up from 26% in its 2025 impact report.
- 9% of employers in the CIPD research discussed in April 2023 had focused on social-mobility inclusion during the preceding five years.
Reviewed 15 October 2026. Pay estimates pool ten years of survey observations; they are not salaries measured in 2026. Employer-index and membership findings describe participating organisations, not all UK employers.
What is the class pay gap?
The class pay gap compares earnings by family socio-economic background, commonly measured through the main household earner’s occupation when a respondent was 14. It differs from a comparison by someone’s current income or job. The Foundation’s headline covers higher managerial, administrative and professional occupations, rather than matched pairs of employees doing identical jobs.
Socio-economic background is not one of the Equality Act 2010’s nine protected characteristics. Class, ethnicity and gender pay gaps answer different questions, and their percentages cannot simply be added together.
How much less do working-class professionals earn?
The Foundation’s published analysis reports the following figures using July–September Labour Force Survey observations pooled across 2014–2023. The gap is an average across occupational groups; it does not establish that background alone caused every pay difference.
| Measure | Annual figure | Period / scope |
|---|---|---|
| Overall class pay gap | £6,287 (about 12%) | Pooled 2014–2023; higher professional/managerial occupations |
| Private-sector class gap | £7,774 | Same research; private-sector subgroup |
| Class gap among women | £6,855 | Same research; women subgroup |
| Professional-managerial-origin salary | £52,211 | Same research; group average |
| Working-class-origin salary | £45,924 | Same research; group average |
Class Pay Gap Day translates a relative annual earnings gap into a campaign calendar date. It is an illustration of the difference, rather than evidence that an employer stops paying people on that date.
What is the ‘class ceiling’ and how big is it?
The “class ceiling” describes barriers to access and progression associated with socio-economic background. Research considers recruitment, professional networks and promotion as well as earnings. These processes require separate evidence: a pay gap by itself does not identify the mechanism.
The Social Mobility Commission’s January 2017 research reported an unadjusted £6,800 (17%) gap. After accounting for education, role and experience, the remaining reported difference was £2,242 (7%). The larger figure should not be presented as the adjusted comparison, and neither is a current salary estimate.
How does socio-economic background affect progression to senior roles?
Progress Together’s August 2025 impact report said the proportion of senior leaders from lower socio-economic backgrounds in its financial-services data increased from 26% to 28%. It reported that more than 92% of member organisations collected background data and that its membership represented over 375,000 employees.
Membership coverage is not the same as the number of valid responses behind each statistic. These findings illustrate one sector’s monitoring; they should not be applied to every UK senior leader or treated as a census of financial services.
How does this fit the wider social mobility picture?
Pay within professional occupations and access to those occupations are distinct aspects of social mobility. A group may be under-represented at entry, at promotion stages or among the highest-paid roles, so monitoring only the overall workforce can miss important differences.
The Social Mobility Commission’s December 2025 State of the Nation report provides the wider official context. Its measures span different cohorts and periods; they should not be turned into a single current probability of success for an individual.
Do UK employers have to report their class pay gap?
There is no general statutory requirement for UK employers to publish a class pay gap as at 15 October 2026. The Equality Act’s section 1 socio-economic duty concerns specified public bodies’ strategic decisions; it is not a class pay-gap reporting requirement. It operates in Scotland and Wales but has not been commenced in England.
The Foundation reports 36 Employer Index entrants measuring their gaps in 2025, compared with 26 a year earlier. This is voluntary participation. The CIPD’s April 2023 discussion reported that 9% of surveyed employers had prioritised social-mobility inclusion during the preceding five years: 17% of large employers and 8% of smaller ones. These are dated survey findings, not a current national audit.
Frequently asked questions
What is the class pay gap in the UK?
It is a difference in pay associated with socio-economic background. The Foundation’s pooled 2014–2023 analysis reports a £6,287 annual average gap, about 12%, within higher managerial, administrative and professional occupations.
How much less do working-class professionals earn?
The same analysis reports £45,924 average annual pay for working-class origins and £52,211 for professional-managerial origins. These pooled estimates are not a 2026 salary benchmark.
What does Class Pay Gap Day mean?
It translates the relative annual gap into a campaign date. It is not the date when a person literally stops being paid, and a new campaign date does not necessarily mean a new single-year dataset.
Do UK employers have to report their class pay gap?
There is no general mandatory class pay-gap reporting requirement. Voluntary measurement should explain the background question, population, missing responses and pay measure used.
Is socio-economic background a protected characteristic?
It is not one of the nine Equality Act protected characteristics. Other discrimination protections can still apply to a person’s treatment, depending on the circumstances.
Related guides
- Ethnicity Pay Gap Statistics UK: Gaps by Group, Trends & Mandatory Reporting
- Disability Employment Gap Statistics UK
- Women in Leadership Statistics UK
- Workplace Discrimination Statistics UK: Tribunal Claims, Prevalence & Protected Characteristics
- Equality Act 2010: The Complete UK Guide
Sources & references
- Social Mobility Foundation: class pay gap and research methodology
- Social Mobility Commission: January 2017 research and adjusted comparison
- Progress Together: 2025 impact report
- CIPD: social mobility at work, April 2023
- Social Mobility Commission: State of the Nation reports
- Equality Act 2010, section 1
Socio-economic background shapes pay and progression as powerfully as any protected characteristic — make sure your team understands inclusive practice and the Equality Act 2010 framework it sits within.
Explore the Equality, Diversity & Inclusion course →
Mark writes about equality, diversity and inclusion, UK workplace compliance and accredited online training for Equality, Diversity & Inclusion Training, part of Online CPD Academy.