
Official figures describe different aspects of ethnic diversity at work. This guide separates population, employment and unemployment measures from company board disclosures, with the period and population stated for each. It was reviewed on 15 October 2026.
Key facts and figures
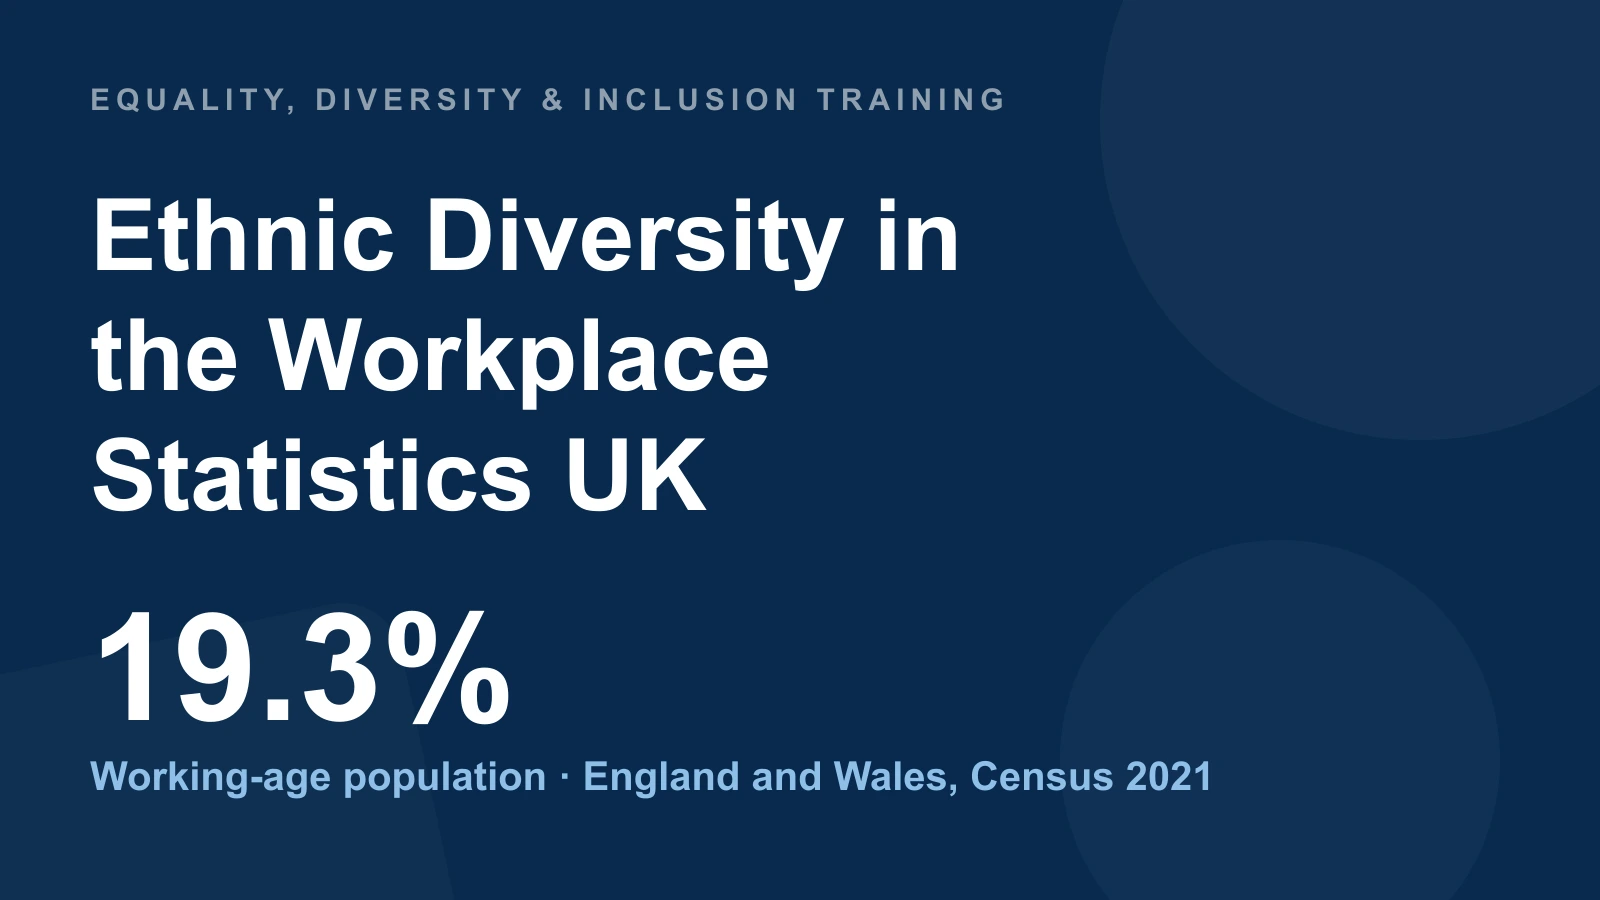
- 19.3% of the population aged 16–64 in England and Wales belonged to Asian, Black, Mixed or Other ethnic groups at Census 2021.
- 8.3% vs 3.9% unemployment among minority-ethnic and White economically active people aged 16+ in the UK, April–June 2026.
- 8 points employment gap: White 77%, all other ethnic groups combined 69%, Great Britain, ages 16–64, 2022.
- 37.4% employment among White Gypsy or Irish Traveller people aged 16+ in England and Wales, Census 2021; White Other was 74.4%.
- 39.8% of Indian workers were in professional occupations in the UK in 2021.
- 98 of 100 FTSE 100 companies had an ethnic-minority director in December 2025, reported by Parker in March 2026.
- 2.3% of FTSE 100 directorships were held by Black directors in December 2025.
- 11% average ethnic-minority representation in UK-based FTSE 100 senior management, December 2025.
Reviewed 15 October 2026. Census, labour-market surveys and company disclosures cover different populations and periods; the dates above are part of each statistic.
What share of the UK workforce is from an ethnic-minority background?
At Census 2021, 7.2 million people aged 16–64 in England and Wales were in Asian, Black, Mixed or Other ethnic groups: 19.3% of that age group. White ethnic groups accounted for 30.2 million, or 80.7%. This is a working-age population measure, not the ethnic composition of everyone employed in the UK.
An employer should consider the location, occupations and qualifications relevant to its recruitment pool. The national working-age share is useful context, but it does not by itself establish whether a particular organisation is under-representative or whether discrimination has occurred.
What is the ethnicity employment gap in the UK?
The Annual Population Survey estimated employment rates of 77% for White people and 69% for all other ethnic groups combined in Great Britain in 2022, among people aged 16–64. The eight-percentage-point difference concerns employment, not pay.
The detailed Pakistani/Bangladeshi category sits within the Asian group and must not be added to the broad categories.
| Ethnic group | Employment rate, 2022 | Difference from White |
|---|---|---|
| White | 77% | — |
| Asian | 70% | −7 points |
| Black | 69% | −8 points |
| Mixed | 69% | −8 points |
| Other | 68% | −9 points |
| Pakistani/Bangladeshi (Asian subgroup) | 61% | −16 points |
These historical rates are retained with their period and geography. Earnings comparisons are covered separately in our ethnicity pay gap statistics.
How large is the ethnic-minority unemployment gap?
In April–June 2026, UK unemployment was 8.3% among minority-ethnic people and 3.9% among White people aged 16 and over, a difference of 4.4 percentage points. The overall rate was 4.8%, according to the House of Commons Library’s August 2026 analysis of ONS data.
Unemployment rates use the economically active population as their denominator: people employed or unemployed. They are not percentages of everyone in an ethnic group. These are survey estimates, and changes for smaller groups can be uncertain.
Which ethnic groups have the highest and lowest employment rates?
In the Census 2021 analysis for England and Wales, employment among people aged 16 and over was highest in the White Other group at 74.4% and lowest in the White Gypsy or Irish Traveller group at 37.4%. These all-adult rates include older people and are not directly comparable with the ages 16–64 survey table above.
Economic inactivity means being outside employment and not meeting the definition of unemployment. In the 2022 Great Britain survey, inactivity among ages 16–64 was 21% for White people and 26% for all other ethnic groups combined; it was 33% for the Pakistani/Bangladeshi group and 15% for White Other. Caring, study, retirement and ill health can all contribute.
Are ethnic-minority workers concentrated in particular occupations?
UK Annual Population Survey data for 2021 found 39.8% of Indian workers in professional occupations and 4.6% of Black workers in managerial, director or senior-official occupations. These are distributions within each ethnic group, not the ethnic composition of those occupations.
The combined share of Pakistani/Bangladeshi workers in elementary, sales/customer-service and process/plant/machine-operative jobs was 33.9%. Occupational differences can contribute to pay gaps, but this table does not identify their causes or measure hiring discrimination.
| Occupation measure, UK 2021 | Group | Share of that group |
|---|---|---|
| Professional occupations | Indian | 39.8% |
| Managers, directors and senior officials | Black | 4.6% |
| Three listed occupation groups combined | Pakistani/Bangladeshi | 33.9% |
ONS flags collection issues affecting some detailed occupational classifications. Hiring experiments are considered separately in our recruitment bias statistics.
How many FTSE 100 boards have an ethnic-minority director?
The March 2026 Parker Review records the position in December 2025. Ninety-eight of the FTSE 100 companies had at least one ethnic-minority director: two companies had not met that benchmark. Ethnic-minority directors held 20% of FTSE 100 board positions.
For the FTSE 250, 205 companies had met the benchmark: 82% of the full index, or 89% of the 231 companies that responded. Ethnic-minority directors held 16% of board positions in the responding companies.
| Parker Review measure | 2019 | December 2025 |
|---|---|---|
| FTSE 100 companies with at least one ethnic-minority director | 52% | 98% |
| FTSE 250 companies with at least one ethnic-minority director, full-index denominator | 22% | 82% |
| Ethnic-minority share of FTSE 100 directorships | — | 20% |
| Ethnic-minority share of responding FTSE 250 directorships | — | 16% |
A company meeting the one-director threshold is different from proportionate representation across its board or management. The Review’s targets are voluntary.
What do the headline board figures hide?
Black directors held 2.3% of FTSE 100 directorships in December 2025, compared with 2.4% in December 2024. Parker compares this with a 3.9% Black share of the England and Wales population aged 30–69 at Census 2021, not the entire current UK population. International board appointments also limit a direct population comparison.
Average ethnic-minority representation across companies’ UK-based FTSE 100 senior management was 11%. Separately, Black managers accounted for 1.3% of the reported senior-management population. A company-average percentage and a pooled share use different denominators and should not be treated as interchangeable.
Among the 50 largest private companies, 21 reported at least one ethnic-minority director: 42% of all 50, or 58% of the 36 respondents. The full-list figure was 48% in the previous report; changes in responses matter when interpreting this comparison.
Frequently asked questions
What percentage of the UK workforce is from an ethnic-minority background?
The 19.3% figure is for the working-age population of England and Wales at Census 2021, not the UK workforce. Its definition groups Asian, Black, Mixed and Other ethnicities together and excludes White ethnic minorities.
What is the ethnicity employment gap?
The 2022 Great Britain survey estimated 77% employment for White people aged 16–64 and 69% for all other ethnic groups combined. The separate UK unemployment comparison for April–June 2026 is 8.3% versus 3.9% of economically active people aged 16+.
How many FTSE 100 companies have an ethnic-minority director?
Ninety-eight of 100 at December 2025, according to the March 2026 Parker Review. This is a company count; 20% is the separate share of directorships.
Which groups had the highest and lowest Census employment rates?
Among people aged 16+ in England and Wales in 2021, White Other was highest at 74.4% and White Gypsy or Irish Traveller lowest at 37.4%.
Is ethnic diversity in the workplace improving?
Board coverage increased from 52% of FTSE 100 companies in 2019 to 98% in December 2025. Labour-market, senior-management and detailed ethnic-group outcomes should be assessed separately; one indicator does not establish improvement across all of them.
Related guides
- Ethnicity Pay Gap Statistics UK: Gaps by Group, Trends & Mandatory Reporting
- Workplace Discrimination Statistics UK: Tribunal Claims, Prevalence & Protected Characteristics
- Women in Leadership Statistics UK
- Equality Act 2010: The Complete UK Guide
- Cultural Diversity in the Workplace: A Practical Guide
Sources & references
- House of Commons Library — Unemployment by ethnic background, August 2026
- ONS — Diversity in the labour market, England and Wales: Census 2021
- Ethnicity facts and figures — Employment, Great Britain, 2022
- Ethnicity facts and figures — Employment by occupation, UK, 2021
- Ethnicity facts and figures — Economic inactivity, 2022
- Parker Review — March 2026 report, December 2025 data
Ethnic-minority workers are one in five of the working-age population but still face a doubled unemployment rate and a thin senior-management pipeline — equip your team to build genuinely inclusive recruitment and progression under the Equality Act 2010.
Explore the Equality, Diversity & Inclusion course →
Mark writes about equality, diversity and inclusion, UK workplace compliance and accredited online training for Equality, Diversity & Inclusion Training, part of Online CPD Academy.